TCS and Four Nifty500 Stocks Trigger Bullish RSI Signals After Five Percent Gains
TCS and four other Nifty500 constituents crossed key technical thresholds on July 13, signaling strengthening price momentum that traders use to identify near-term buying opportunities.
On July 13, TCS and four other constituents of India’s Nifty500 index registered single-day gains exceeding 5 percent, triggering bullish Relative Strength Index (RSI) signals based on recent market data. The technical scan identifies an uptrend signal specifically when an asset’s RSI value crosses above the 50 threshold from lower levels.
This crossover is a critical technical milestone for market analysts monitoring price trends. A reading labeled as “RSI trending up” indicates that Relative Strength Index values are consistently rising.
This pattern suggests strengthening momentum in the stock’s price action, distinguishing it from transient volatility. In momentum-driven markets, traders frequently utilize this specific technical behavior to identify actionable buying opportunities.
The indicator serves as a quantitative measure of potential upward movement in the near term. The five highlighted equities demonstrated a decisive break above the neutral benchmark.
The highest current market price (CMP) among the group stood at Rs 2,374.8, accompanied by an RSI of 61.17, a notable increase from its previous reading of 49.46. A second security in the scan reached a CMP of Rs 1,349.5, with its RSI climbing to 60.08 from a prior 47.81.
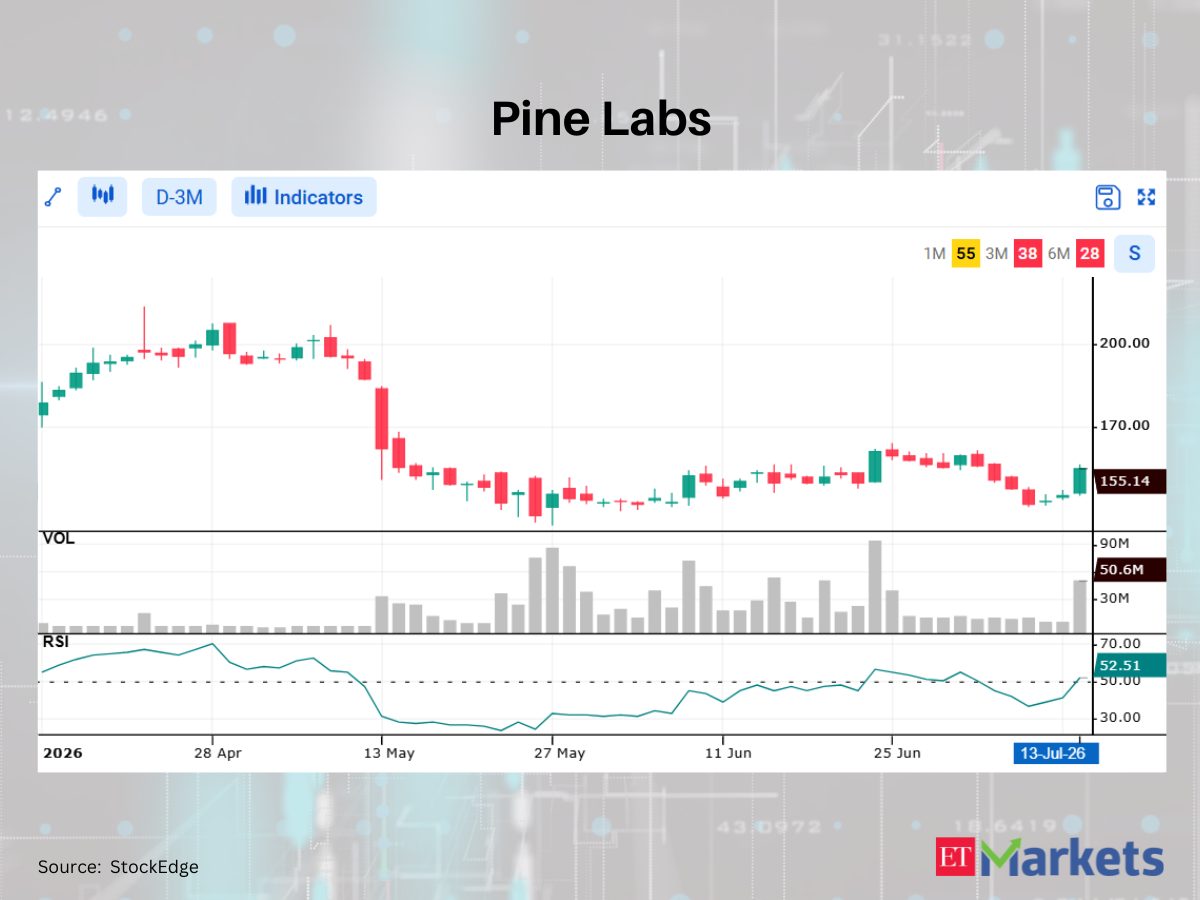
Both figures reflect a solid transition into bullish territory. The remaining three stocks also cleared the 50-point benchmark, closing at current market prices of Rs 2,181.5, Rs 700.95, and Rs 155.14.
Their respective RSI readings advanced to 54.36, 53.54, and 52.51, ascending from previous levels of 43.04, 44.61, and 41.61. This uniform crossover across varying price points underscores a synchronized shift in short-term trading dynamics for these specific Nifty500 constituents.
The inclusion of a major market participant like TCS alongside other equities broadens the observed momentum. For investors and portfolio managers, such clustered technical breakouts warrant close monitoring.
The convergence of a greater than 5 percent price gain with a decisive RSI crossover provides a layered signal of sustained buyer conviction. Market participants will likely view this data as a validation of recent buying pressure.