Eight Nifty 500 Stocks Close Above 200-Day Moving Average
Eight companies in India’s Nifty 500 index closed above their 200-day moving averages on July 21, 2026, signaling potential upward momentum for technical traders monitoring trend shifts.
Eight stocks within the Nifty 500 index closed above their 200-day moving averages on July 21, 2026. This technical milestone is closely watched by market participants as a primary indicator of a sustained upward trend.
The 200-day moving average serves as a critical benchmark for assessing long-term momentum. When a stock’s price remains above this level on a daily timeframe, traders generally interpret it as a signal of overall bullish sentiment.
Mahindra & Mahindra Financial Services saw its last traded price reach Rs 349.85 against a 200 DMA of Rs 329.84. Jaiprakash Power Ventures also crossed the threshold, trading at Rs 17.75 compared to its 200 DMA of Rs 17.33.
In the industrial and infrastructure sectors, Garden Reach Shipbuilders & Engineers recorded a last traded price of Rs 2619.7, surpassing its 200 DMA of Rs 2576.14. JK Cement moved to Rs 5658, edging past its 200-day average of Rs 5605.99.
The telecommunications and automotive segments also saw representation in this technical shift. Bharti Hexacom traded at Rs 1651.1, above its 200 DMA of Rs 1635.43, while ZF Commercial reached Rs 2398.6, clearing its 200-day mark of Rs 2377.7.
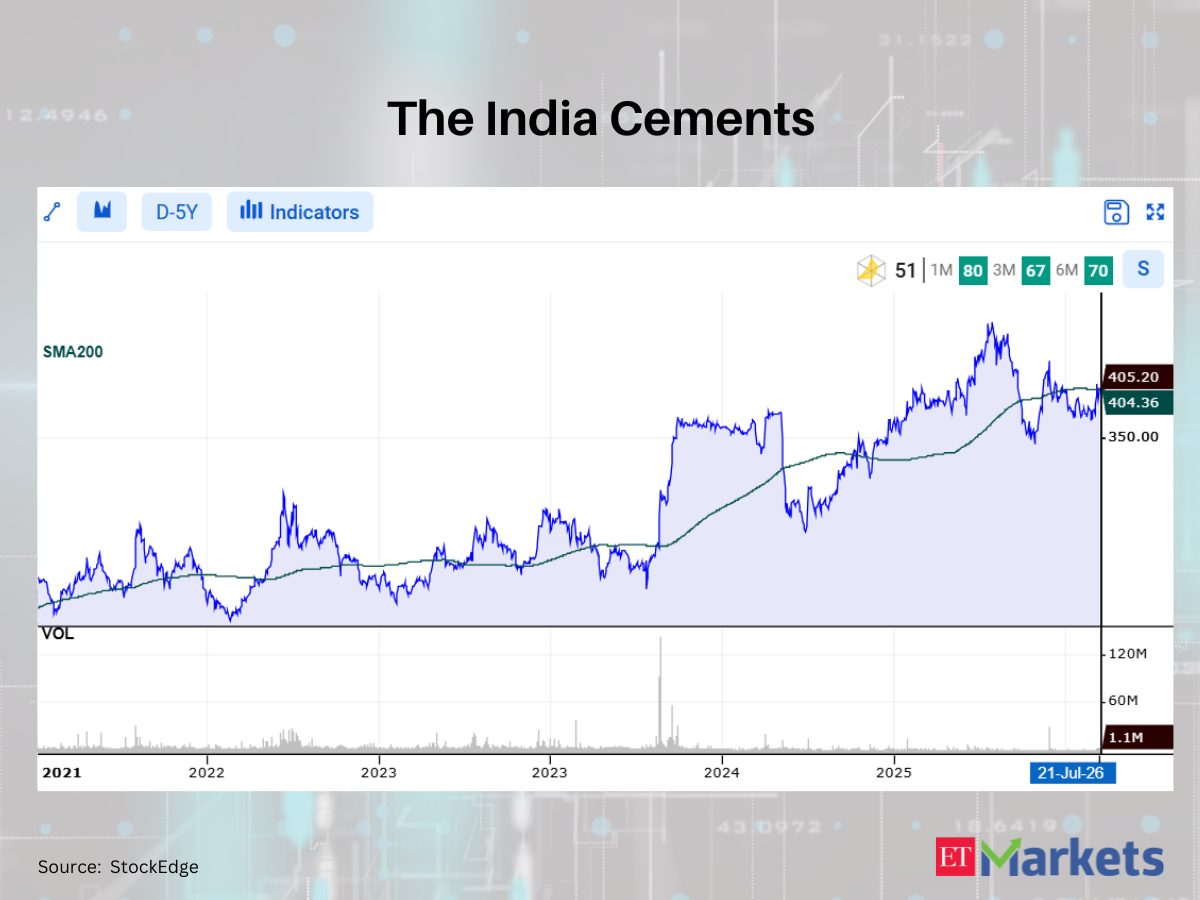
Consumer and materials stocks rounded out the group of eight. Berger Paints India closed at Rs 506.4, marginally higher than its 200 DMA of Rs 503.05, and The India Cements finished at Rs 405.2, just above its 200-day average of Rs 404.36.
For institutional investors and portfolio managers, these crossovers can trigger algorithmic buying strategies or prompt a reassessment of sector risk exposure. A cluster of such breakouts within a major benchmark index often suggests broadening market participation, indicating that capital is rotating into a wider array of equities.
Nevertheless, technical indicators are not infallible predictors of future corporate performance. Prudent market professionals typically combine moving average analysis with fundamental earnings data and daily trading volume to confirm the underlying strength of a new trend before committing significant capital.
+38