Five Nifty500 Stocks Flash Bullish White Marubozu Pattern
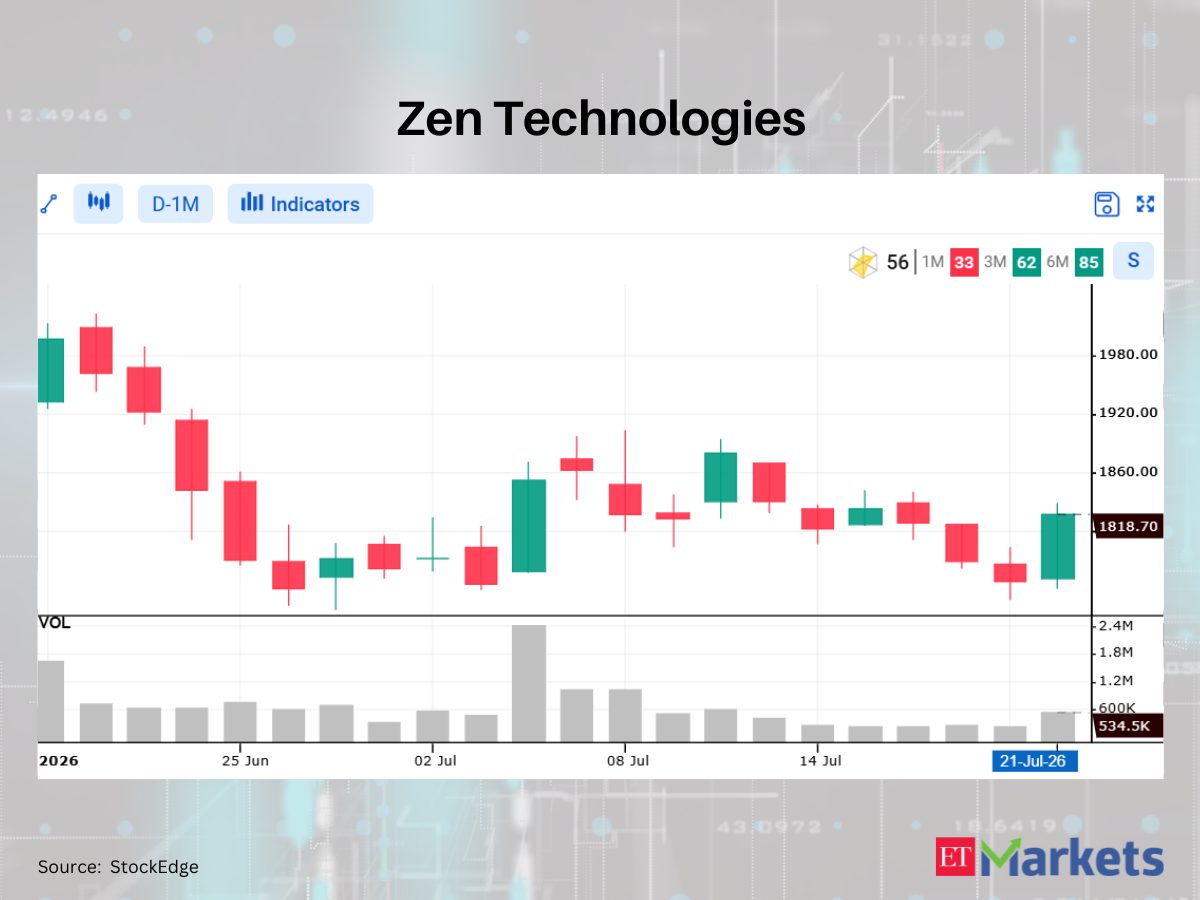
Five companies in India's Nifty500 index, including TVS Motor Company, exhibited a rare bullish candlestick formation on July 21, signaling strong intraday buying pressure and potential upward momentum for technical traders.
Technical scanners identified five stocks within the Nifty500 index displaying a White Marubozu pattern at the close of trading on July 21. The formation, highlighted by data from StockEdge, suggests that buyers maintained strict control over the session from the opening bell to the final close.
Among the companies triggering the bullish signal is TVS Motor Company. The broader group of five equities posted significant daily gains, reflecting aggressive accumulation by market participants. The individual stock performances for the day showed closing price increases of 6.74 percent, 5.62 percent, 4.78 percent, 4.35 percent, and 3.94 percent.
The corresponding closing prices for these five advancing equities were recorded at Rs 4607.1, Rs 3792, Rs 217.97, Rs 351.75, and Rs 1818.7. Such uniform upward movement across different price tiers indicates broad-based intraday strength rather than isolated speculative spikes.
In technical analysis, a White Marubozu is a specific candlestick formation characterized by a long white or green body. The pattern occurs when the opening price of the asset serves as the absolute lowest point of the trading period, while the closing price marks the highest point.
Crucially, this formation features no upper shadow and either a very small or completely nonexistent lower shadow. For market professionals and chartists, the absence of shadows signifies that the asset traded exclusively within a tight upward channel without facing meaningful selling pressure or retracements during the session.
Market participants utilize these distinct chart formations to gauge momentum and establish strategic positions. When an equity prints this specific candle, chartists interpret it as definitive proof that buyers dominated the entire trading session without interruption.
The appearance of five such signals in a single session within the Nifty500 provides technical traders with multiple candidates for potential uptrend strategies. Investors utilizing algorithmic scanners often use these precise candlestick formations to filter market noise and identify stocks where institutional or aggressive retail capital is actively driving the price higher.
While technical indicators do not guarantee future fundamental performance, they remain a critical component of short-term momentum trading. The identification of these five stocks offers active market participants clear entry points or confirmation signals for existing long positions as they assess the immediate directional bias of the Indian equity market.